Total Pageviews

Monday, June 23, 2014

P G


Procter and Gamble Company is operating in 180 countries and region all over the world. Its key driver in generating its cash flow is its business territory at USA which is more than 39 percent of its worldwide total sales. The largest segment in its revenue is coming up from Fabric care and home care which is 32 % of total revenue. The second segment is beauty product which is at 24 % of sales.
According to IMF, economic growth of USA is predicted at 2 % It means the company has good opportunity to grow better. The last sales growth in 2012-2013 is 0.6 percent. The company categorizes its territory in to five major areas which are North America, Western Europe, Asia, Latin America and CEEMEA.
                  2011
                  2012
            2013
North America
41.0
39.0
39.0
western Europe
20.0
19.0
18.0
Asia
16.0
18.0
18.0
Latin America
9.0
10.0
10.0
CEEMEA
14.0
14.0
15.0

Segments
Percentage
Fabric Care and Home Care
32
Beauty
24
Grooming
9
Healthcare
15
Baby care and Family care
20

Forecast of Net sales
There is a significant correlation between its Capital expenditure and net sales. With in simple analysis we could find its correlation is more than 0.7 which means indicating strong correlation. Based on data of economic growth of USA in 2008 -2012 and data of its worldwide net sales in 2008 -2012, there is strong correlation between economic growth of USA and its net sales. It could be concluded that USA economy still having strong influence to its revenue.
If I used CAGR of Capital expenditure in 2008 – 2012, I find its CAGR is at 6 %. Within assumption of 6 % growth of its capex in 2014, I make assumption that its worldwide sales will grow 2 % up. In another factor IMF has prediction that US economy will grow 2 percent.


The forecasting of financial condition between in 2012-2016 is as the following table:
ROE
2012
2013
2014
2015
2016
Net Profit margin
13.0
13.5
13.5
13.3
13.1
Asset Turn Over
63.3
60.4
55.9
51.4
47.7
ROA
8.2
8.2
7.5
6.8
6.2
Financial Leverage
208.5
204.6
193.0
186.8
182.1
ROE
17.2
16.8
14.5
12.7
11.3

2013
2014
2015
2016
CFO
8071.0
10254.8
10425.7
10580.5
Net Addition of Fixed Asset
-3087.0
-4208.4
-4292.5
-4378.4
Free Cash Flow
4984.0
6046.4
6133.2
6202.1


From table at above the assumption of free cash flow in 2016 is forecasted to 6202.1, the result is calculated with steady net sales growth at annually in 2 % from 2014 until 2016 and capital expenditure is  at 5% net sales in 2014-205. 


The company is mature and it is the market leader in almost all segments and its territory. It causes its sales growth very low in 0-2 percent in the last five years.

The CEO encourages all employees to make innovation as in his book in Game Changer. The company tends to decrease its employee in several years. In 2008 the number of employee was 135,000. It was decreased in to 121,000 people. The company looks using more technology and more outsourcing to reduce cost and enhance its profit.
All products and its manufacture process are protected with patent and license. Its good will and intangible assets in 2013 are more than 60 percent of its total asset. That means trade mark and its patent right are valuable asset for the company as their trademarks are market leader in each segment.


Sunday, June 1, 2014

UNVR


Background
Indonesia’s economy has consistent growth in its public consumption and investment. 97 % of its GDP is contributed by its domestic economy. The World Bank forecasted that Indonesia’s economy will grow 5.3 % in its report at quarter 3/2013. Its domestic economy consists of public consumption which is at 55 % of GDP and investment which is at 34 % of GDP.
Steady economy is accompanied by relatively stable inflation and healthy demographic structure with high productive age number. With that strength of Indonesia’s economy, public consumption and investment are expected continue to grow as the key driver of economic growth.

Inflation rate vs. BI Rate
Inflation rate (yoy) in 2013 is at 7.25 %, this is higher than previous year which was at 4.3 %.in order to control inflation rate government increase BI Rate at 7.5 %. With regression analysis we could find the correlation between BI rate and inflation rate in 2007-2013 with t-stat at 3.9 or bigger than 2. If BI rate is still 7.5 %, it will reduce the inflation rate from 7.25 % in to 6.90 %.
Once the inflation rate decline usually investor will expect central bank to reduce its BI rate. And people will be expected to increase their public consumption and investment.

UNVR
 UNVR is one of the favorite stocks in IHSG. In fundamental analysis, UNVR has a consistent growth in the several years as low competitiveness in Indonesia. The foreign investment such as UNVR is able to be a market leader easier. In the period of 2007 – 2013, the company has Compound annual growth rate (CAGR) at 16.1 % in its net sales. With regression analysis between non oil and gas manufacturing and net sales of the company, the possible sales growth in 2014 is at 16.1 % higher than its sales in 2013 which was at 12.7 %.
With possible lower inflation rate in 2014, public consumption will be higher. BI Rate is possible not changing and the inflation rate may have been reduced. People tend to increase its consumption include consumer goods, house hold product, food and beverage.
Good news from UNVR, the company has no long term debt. That means the company has strong internal source of fund. The company has good liquidity. 


Forecast
I used lattes CAGR to make simple assumption in sales of 2014. CAGR of 2007 -2013 is at 16.1 %. I made assumption that sales will experience consistent growth in 2014 – 2016. I took gross profit margin at 51.3 % of sales. I used assumption that the company will spend 5 % of its net sales for capital expenditure and it will be still used its short term loan as its source of fund to finance its asset.
The key ratio in 2012-2016 of its forecasting is as the following list

Ratio analysis
Net Profit margin
16.8
16.0
16.0
16.0
16.1
Asset Turn Over
227.8
230.4
175.4
145.5
126.8
ROA
38.3
36.8
28.1
23.3
20.4
Financial Leverage
302.0
313.7
203.9
171.2
155.7
ROE
115.7
115.4
57.4
40.0
31.7
Net Sales
27,303,248.0
30,757,435.0
35,678,624.6
41,387,204.5
48,009,157.3
CFO
5,751,738.0
6,616,947.3
7,539,803.3
8,747,675.8
Net Add fixed asset
1,031,438.0
1,537,871.8
1,783,931.2
2,069,360.2
Free Cash Flow
4,720,300.0
5,079,075.6
5,755,872.1
6,678,315.5


Thursday, May 22, 2014

PGN -PGAS


Macroeconomic
According to the World Bank in 3/2013 the economic growth of Indonesia will grow at 5.3 %. The nation is still having good expectation for investment. Our economic growth is driven by larger domestic consumption that contributes more than 50 % of total GDP. The challenges are still at our inflation rate, current account deficit and currency exchange rate.

One of vulnerable thing in Indonesia is the capital inflow from abroad that could change currency rate and capital market index level. Our market capitalization is only 60 % of GDP. This is lower than others nations at south East Asia such as Malaysia at 270 %, Thailand at 170 % and Philippines at 140 %.  The majority of Capital inflow from global market seems act as speculative investor which tends to invest in short time. They seem investing money not based on fundamental analysis but they tend to use technical analysis. As sample commonly emerging market does not have good stability in politic, especially in election year.  They could differentiate their stock value with derivative transaction to beat rupiah exchange rate down or up.
In other side the capital inflow could also as a good sign that the circumstances in Indonesia will be better then they will do profit taking once their stock price increase.  

In May 2014, the IHSG index exceeds level of 5000, huge capital inflow amounting to USD 184 million gets inside to Indonesia through capital market. The impact to our economic is not too significant but I think investor will remove their money if the politic circumstances will not be stable in the future especially after president election party. The rupiah exchange rate may decline.  

In global industry the oil price is affected by its production. Commonly the production of oil is affected by geopolitical issues in Middle East such as Iran, Israel, Persian Gulf and etc.
Another problem in Indonesia is our policy in subsidized oil that spends a lot of cost. If the subsidized oil is suddenly no longer exists the inflation rate will jump. in order to anticipate the condition Government has been done energy conversion from oil in to gas. Public transportation is starting to use gas as its fuel.
Based on data in the 2008 -2012 Indonesia was a net importer of oil which means its consumption exceeds its production. It was inversely with natural gas industry in Indonesia which is experiencing surplus. The production exceeds our consumption.

The gas consumption will be higher at the future as our government policy would like to reduce its subsidy in oil consumption. The natural gas industry will take more portions in producing energy and fuel consumption for public transportation.


Perusahaan Gas Negara

The revenue of the company in 2013 is 16.3 % higher compared to previous year. The gross profit margin is lower than 2012 from 57 in to 47 percent. The decline may be caused by gas price. Because of that net profit margin and EBITDA decline.

The majority of the revenue is from sale the natural gas to its client. PGN buys gas from pertamina and its join operation company to other company. In May 2013, the company buy asset of oil and gas property through its subsidiary SEI in ketapang, bangkanai and ujung pangkah. In 2012 its asset of oil and gas property is zero. PGN starts to act as gas exploration and production in 2013.
PGN has huge amount of cash and restricted cash, it is suitable with the nature of business of oil and Gas Company which is usually having huge of cash, depletion and depreciation and also huge tax.

The revenue in the future will be higher than 16 % as its acquisition in three blocks at java and Kalimantan. I just did stress test that revenue increase 5 % and the capital expenditure is 5 % of sales the company will reach similar earning per share at 0.04 the same as earning per share in 2012. I used same gross margin, activity ratio and I did adjustment the company will pay the short term debt off in 2013. If you are interested to my model, you could send sms to me.

The company has short term debt in bank Sumitomo Mitsui and bank of Tokyo Mitsubishi, the each amount is USD 200 million and USD 100 million.


Tuesday, May 6, 2014

BBRI


Economic condition of 2014
Indonesia seems stable in its economic growth in 2014, according to the expert it will be at range of 5.8- 6.2. It is slower than economic growth in 2013 which was forecasted at 5.7 % up. Indonesia has good competitive advantage in its economic, this is stable and this is supported by more than 50 % domestic consumption.
As long as people have strong ability in buying goods and the inflation rate is better, the condition will be better. BI rate is at 7.5 %, it is predicted that it will be higher at 2014. The deficit of current account which is contributed by oil and gas sector as main contributor make the central bank keep BI rate at the point.
The current account deficit will be still high in 2014. The lack of government policy in oil and gas sector increases its business risk and the similar problem is also occurred in biodiesel conversion policy in a mixture of diesel. It is difficult to reduce trade deficit in diesel imports. The crisis at Ukraine will trigger higher oil price and finally will increase inflation rate. Higher its rate will force central bank keep Bi rate still high.
76 % of imports are raw material items which means our consumption is not matching with domestic raw material either its number or availability.
I think if industry produce goods which are supported with more local raw material the trade deficit will be able to be reduced.
Central Bank has changed its required reserve from 5 % in to 8 %. With higher reserve, the banks are expected safer. Based on data 2013 credit growth is at 22.2 % yoy in October 2013, this is slower than its growth with 23.1 % on September 2013. This regulation increases its barrier to entry for new comers who have to have more capital to establish Bank.

Bank Rakyat Indonesia
The company still concerns in its core business, the credit retail segment. The micro segment is at 30.7 % of total loan although this is smaller than the retail banking. Since they have launched TerasBRI, its network and product development has been better. TerasBRI as the part of its micro strategic has increased both micro Loan and micro deposit significantly in 2012. Micro segment is designed for personal customer with competitive product such as Kredit Usaha Rakyat and Kupedes as the lending product and simpedes as funding product.

The company expanded its micro infrastructure with 5000 BRI units, 1,778 TerasBRI and 350 mobile TerasBRI.

In 2012 the loan of the company is at IDR 362 trillion. It increases 22.9 % higher than loan in 2011.  Based its loan composition in 2012, the biggest loan of its loan is retail segment with 42 % of total loan. I took rediction the loan will increase 19 % higher with increase of interest income at 20 % in 2014.
In 2008-2012 The company have good loan to deposit ratio, good capital adequacy ratio and low Non performing loan. The asset has average growth at 22.5 % in 2008-2012. The other good news is its average growth of fund from third party in 2008-2012 is at 27.45 %.

As the economic growth in 2014 is predicted in lower rate because of the election schedule in the year, I forecast the placement with bank Indonesia will be higher than 2013 at 20 % increase.
I took prediction that EPS will increase to 1.026, 1,357, 1,543 with consecutive growth 2014-2016 at 20%,25 %, 20%. In 2015 the loan assessment will at 25 % as the optimistic condition of new government.

As long as government could decrease deficit  in current account  inflation rate and Bi rate will be stable.      


If you are interested to my forecasting of BBRI you could send sms 081217596612.


Monday, February 17, 2014

ELNUSA - ELSA


Macro economy in Indonesia
The Central Bank expected GDP growth in 2013 is approximately at 5.5 % - 5.9 %, this is lower than economic growth in 2012 which is at 6.2 %. BI Rate at recent is at 7.5 %, it has been increased from 5.75 % in December of 2012, BI seems continue in conducting tight money policy until the elections end at 2014. Central Bank expects that GDP growth in 2014 will in range 5.8 – 6.2 %.
The quality of economic growth has to be prior concerns. Who are growing reach and who are downing poor?  Some strategy has been done such as direct cash support for the poor citizen who has been done in the last three years.  Each person was given cash amounting to IDR 300 thousands rupiahs.
Meanwhile Organization for economic and Development (OECD) in last October that Indonesia’s economy would grow at an average growth of 6 % during the period 2014 – 2018. I think the prosperity of Indonesia is still questionable; it depends on the elected president who will determine policies as the one of key driver of the advancement.  In other side, the nation gets several volcano disasters at few places, so far it does not ruin significantly. 


Based on the data at the last three years, proven reserves of oil in Indonesia tend to decline. Inversely with proven reserves of gas, it tends to rise. According to ministry of energy and mineral resources the energy supply in 2012 amounted to 1,776 million Barrels. The petroleum based fuel is 13.83 % of total energy mix and the Natural gas is 23.18 % of total energy mix. Natural gas will be more dominated than oil in the future.
In 2012 Indonesian upstream oil and gas business executive board is dissolute by the constitutional court based on its resolution no. 36/PUU-x/2012 on 13rd November 2012. The government made new council, the Provisional Executive Work Unit (SKSP Migas). That event did not affect all contracts which are called as PSC as existing contracts.


Key Driver
The contracts of Pertamina are the main source of revenue.  Pertamina has 41 % share of PT. Elnusa. Pertamina is Oil Company which is owned by government and it has many oil and gas projects in Indonesia. The growth of the company depends on performance of pertamina. Pertamina also has many affiliates such as Patra Niaga, pertamina E & P, pertamina hulu and etc.
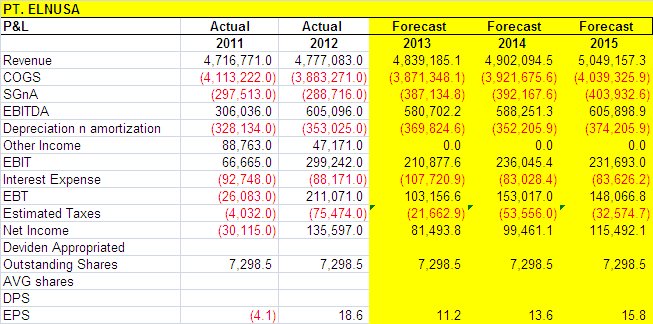
In 2011 – 2012 the company performs its growth with 1.3 % up in its revenue. The slow growth is affected by the number of oil and gas projects in 2012.
In 2011 -2012 the company has available cash more than 10 % of its sales. It means the company tends to allocate the cash in to the Bank as time deposit, call deposit and saving account. It seems they has no new project yet which need fund to be allocated in.
I adjust that the company will able to increase its sales with the same growth because there are no new reserves found. Its revenue will come from repeated order from existing project..


Monday, February 10, 2014

Semen Indonesia - SMGR


Semen Indonesia
Strategic Holding company as its business strategic 
Semen Gresik Group has already changed its name to be Semen Indonesia in 2012. The company was established in 1953 as NV Pabrik Semen Gresik. The company runs its business in cement industry at Indonesia and Vietnam. The company has several cement plant in Gresik, Tuban, Indarung, pangkep and quang ninh in Vietnam. The major shares holder as its controller is government of republic Indonesia.
In order to advance its growth, semen Indonesia is made as  company holding of companies under the Semen Gresik group includes semen tonasa, semen padang and semen gresik.
With this strategic holding company, the company will increase its value, reduce operating costs, strengthen its brand equity, increase capacity and expand to south East Asia such as Vietnam.
Financial condition
In 2012 revenue increases 19.7 %compared in 2011. The increase is caused by better volume of cement which had been sold. The volume of sales is up 40,9 % higher than 2011. The increase in sales is followed by increase in net profit, it is 23,5 % higher. The company has very strong position in market; it has 41 % of market share of cement industry in Indonesia. The position is stronger with additional plant which could increase its capacity. The company built 2 plant and buy new company in Vietnam in 2012.
Higher revenue with higher profit means the company could make better sales with better profit margin.
But there was a question about increase of its intangible asset from IDR 4.8 billion to IDR 1 trillion in between 2011-2012. This is the massive increase. The big portion of this increase comes from license and trademark of Thang long cement of Vietnam which has been bought in 2012.
In 2012 the day receivable is 38 days slower than 2011 which is 33 days. The same happen with its Days inventory which is become slower in 2012 compared to 2011, but its cash to cash cycle is faster, which is at 64 days compared to previous year which is at 83 days. 


Forecasting
I estimated increase of revenue in 2013 is at high growth rate after purchase thang long cement in Vietnam with 19 % up, I think the real sales of 2013 has been appeared, it is just my estimation based on economic situation in 2013 which is has lower growth of GDP than 2012. In 2014 the economic condition may be at lower growth because of election of president and senate. We need to watch interest rate, inflation and economic growth in Vietnam.    

Key Person
Dwi Soetjipto has already done his job as CEO since 2005. He joined semen padang in 1981, his previous job is as CEO of semen Padang. Dwi Soetjipto has doctoral degree of university of Indonesia.  He got great experience in cement industry since 1981. Within his expertise the new holding company will be able to advance its value more at the future.
My opinion
My analysis needs more improvement especially in its depreciation rate in 2011. Increase of fixed asset  (gross) in 2011 – 2012 is IDR 6.18 trillion.